Hello,
this article describes how to create visualizations for the recently released
Uber 2D Demo Viewer.
Introduction
This is still an evolving process, and the current solution involves quite some manual work. You need to be a bit techie and be familiar with different tools (3D modeling/rendering, Photoshop, Radiant).
Process
1. The first step is to generate a 2D rendering or illustration of a map. On this
article, I described a process to extract Quake Live maps.
Once you get the 3D model out, the tricky part starts. Ideally you would like to remove any surface whose normal is pointing downward. This is however not enough. Maps have tons of "hidden polygons" outside the reachable walls, and all those contribute in screwing up visualizations.
For the existing visualizations I use Deep Exploration CAD edition 6.1. The nice thing about it is that it offers various neat features for illustrating a model.
1.1. First, it allows to group together surfaces, in order to hide them. This is particularly handy as you will need to hide tons of things. Use the predefined keys for the top (t), bottom(b), front (f), back (a), left (l), and right(r), to place your point of view, then use the Square Selection (CTRL+drag) to add surfaces to the selection, (ALT+drag to remove surfaces). Then, go to the "Scene" pannel, right click on any of the blue-selected surfaces and select "Create Group". You can then uncheck the group to make it invisible. This is better than deleting, as you may evetually find out you want to get something back.
1.2 For visualizing, Deep Exploration offers neat features. You can switch between orthographic/perspective camera (press p). You can set polygons to be rendered in different ways. As shown in the screenshot below, select a bunch of polygons, right click properties, go to attributes, and click on render method. I suggest you to experiment with "Transparent" and "Solid Outline" with opacity at 50%.
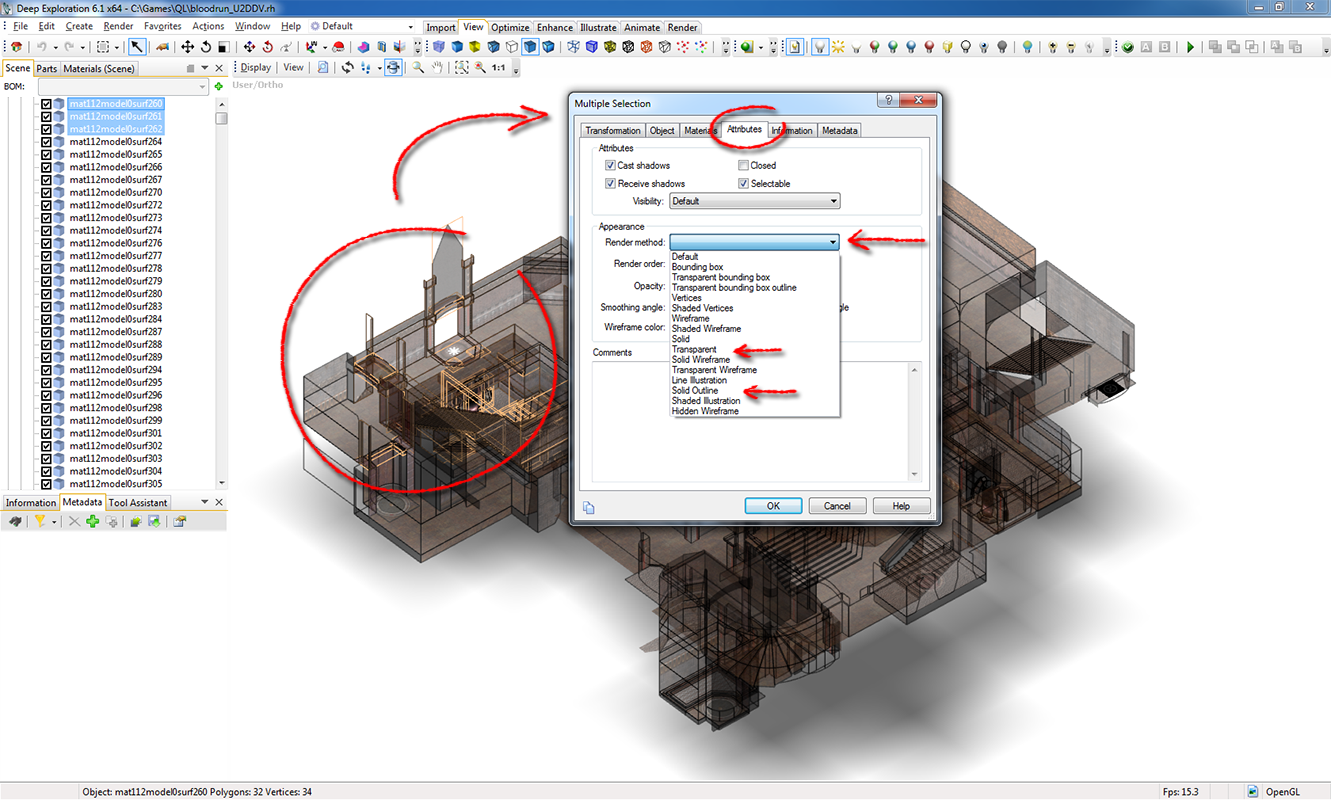
Ideally you want to set anything that needs an outline to (walls) to "Solid Outline" with opacity at 50%, and the rest (floors, cracks, anything that is not relevant to the gameplay) as "Transparent". I personally start with everything as "Solid Outline" and then start clicking everything I don't like from a top view and make it "Transparent". Going the reverse way may also work.
1.3 You can add lights (Create > Point Light) and position them to enhance visibility. If you don't see the light, make sure you click on it in the "Scene" panel, then select the "move tool " (a cross with arrow tips), and rotate your point of view (you won't see your light from a top view!).
Once you created a 2D image, you need to save it as PNG with the name of the map, and place it in the "..\U2DDV_v0.1\data\maps" folder.
2. The second part is to create a simple text file that includes the boundaries of your visualizations in Quake coordinates.
This process requires you to have q3radiant (or gtk-, or net-) installed, as well as the .map file for the arena you are working on. You should have the converted .map if you did step 1 using the
QL Map Converter, as proposed in the article above.
Done manually this process may be quite annoying, as it all depends on how much margin you have left around the map in your visualization. In the readme file in "..\U2DDV_v0.1\data\maps" you find a dirty hack on how do this.
To make the process simpler, I coded a simple
Map Ruler (thanks

myT for hosting). The process on how to use this is below.
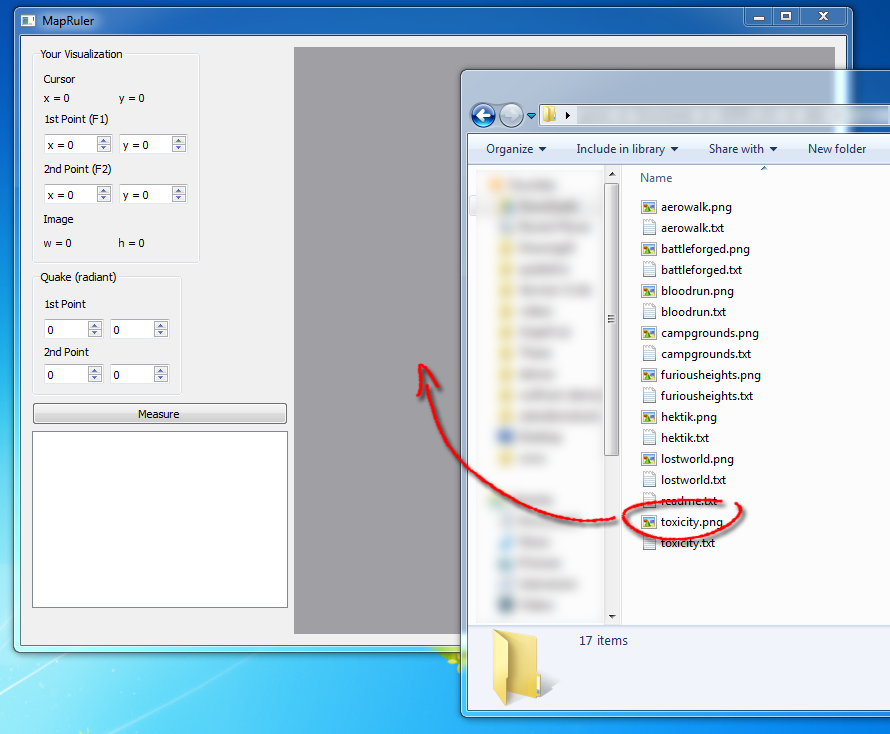
2.1 Download the
Map Ruler. Open the program, and drag and drop your visualization file into it.
2.2 Now you need to specify two locations of the map that you are sure you can recognize within q3radiant (the corner of a room, a special polygon, whatever). One of them will be called the top-left point, the other the bottom-right point.
The UI may not be super intuitive, but just do the following:
- move your cursor to the visualization area, and
keep the left button pressed. You should see the "Cursor" coordinates updating as you move the mouse.
- Keeping pressed, go to the top-left point and press
F1. A small green dot should appear.
- Now go to the bottom-right and press
F2
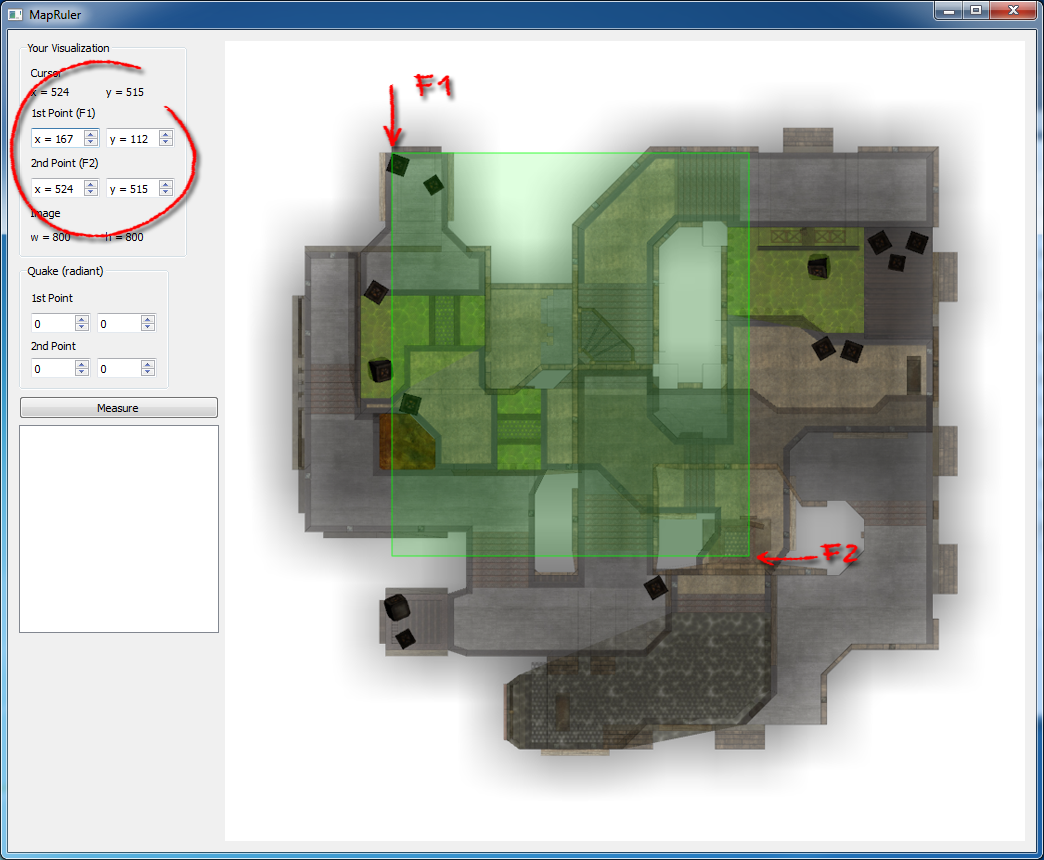
If you have done things right, you should see the entries of 1st and 2nd point to be automatically entered. Notice that you could as well enter the values directly, but I guess using the F1/F2 trick it's easier.
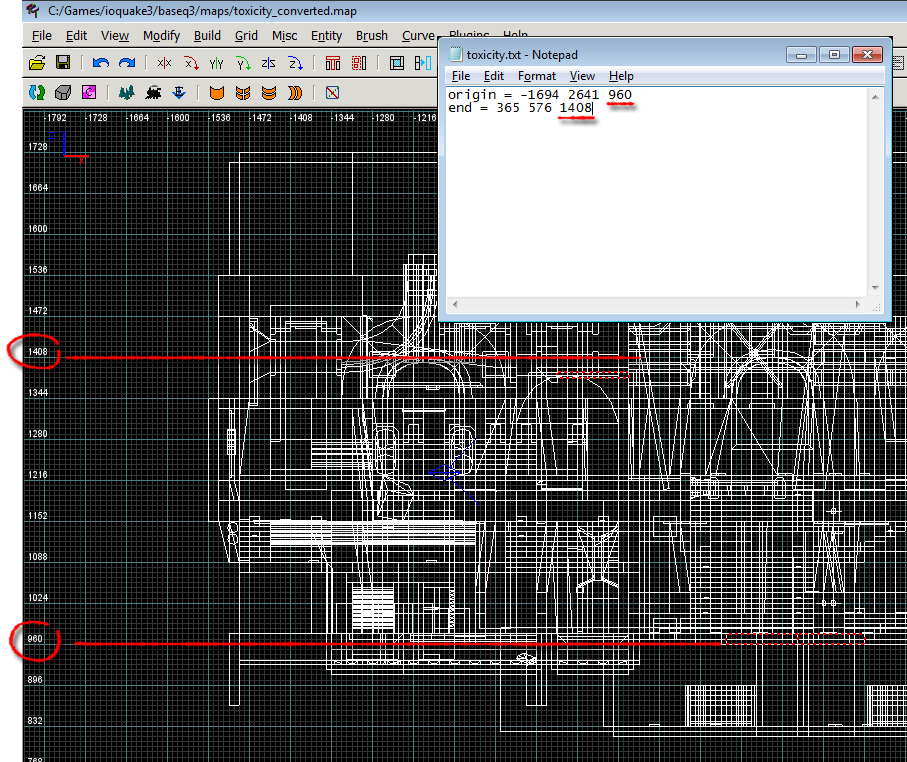
2.3 Now you need to go to radiant, and open the map. Your goal is to find out the Quake coordinates of the two points.
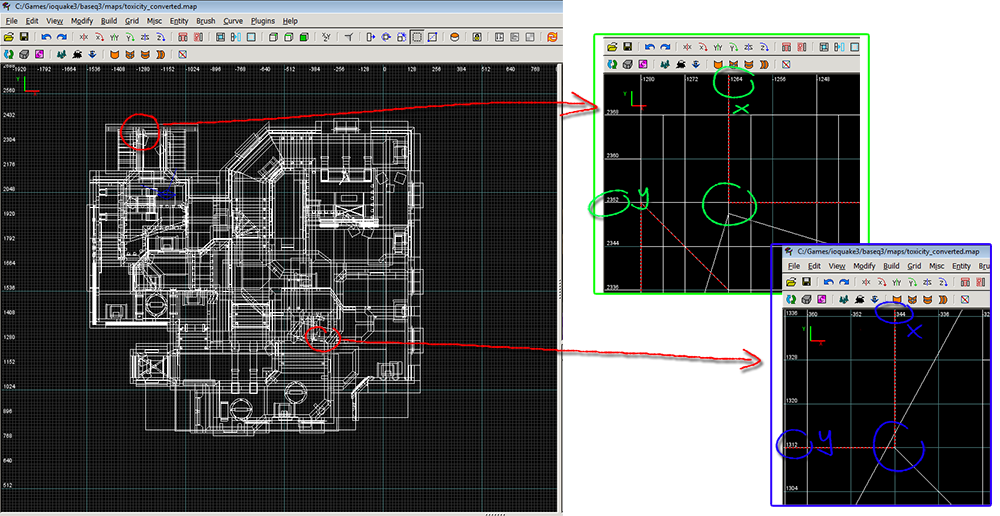
Go to the two locations, zoom in, and mark the x,y coordinates of the points.
2.4. Once you inserted the Quake (radiant) coordinates, click on Measure. Right below, the scaling text should appear!
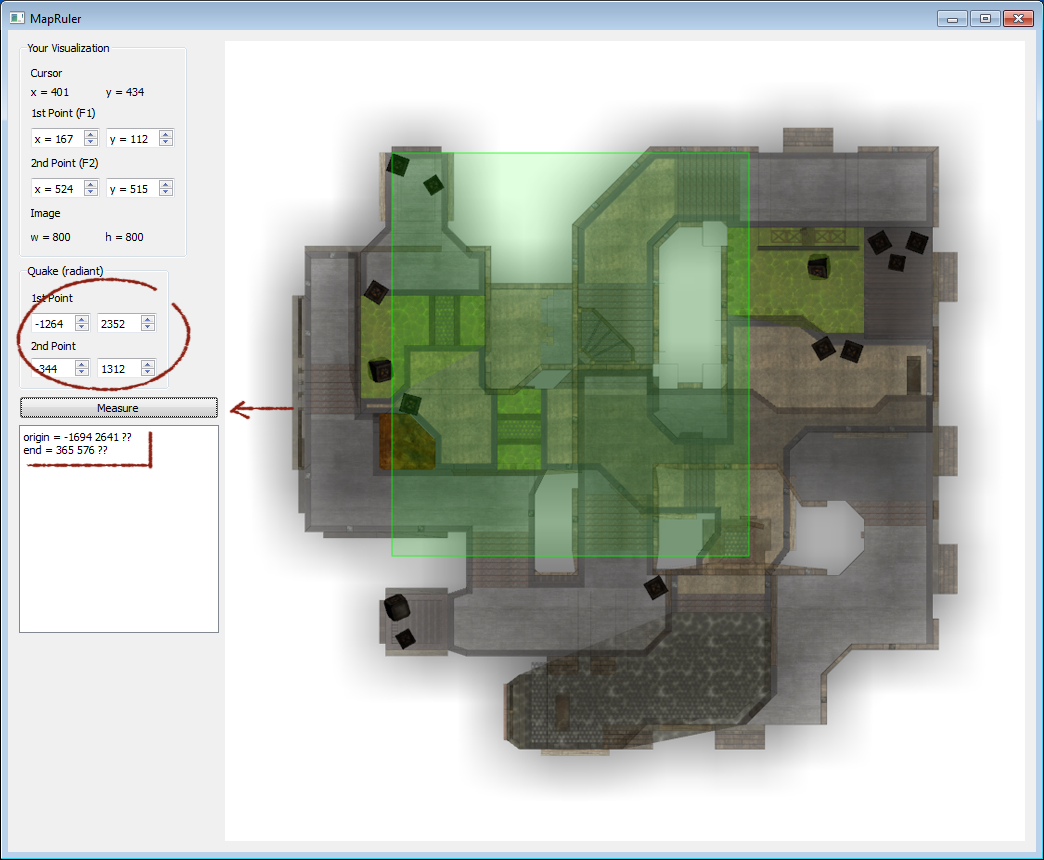
Save this text into "..U2DDV_v0.1datamaps" as .txt file with the name of the map.
2.5 The last step is to add the missing Z (height) coordinates. These will drive the scaling of the players dots in the demo viewer. Go to radiant, find the bottom floor, and the highest ceiling, and fill in the coordinates (origin for bottom, end for top).
3. If you have done everything correctly, your "..\U2DDV_v0.1\data\maps" folder should now contain "yourmap.png" and "yourmap.txt". Whenever the demo viewer recognizes "yourmap" being played, it will load your visualizations. If you have made mistakes in the formatting of the .txt file, the log window should complain.
Good luck!


Is the bottom most floor also transparent?